
You can easily create in-cell bar graphs in Microsoft Excel with the help of repeat function as shown in the below picture
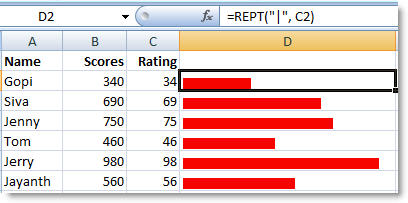
REPT function ‘repeats text a given number of times.’ For example REPT(“0”, 10) outputs the text “000000000”. To generate bar graphs the trick is repeat "|" (pipe symbol) required number of times.
The above shown graph is formatted with font "Bell Gothic Std Light 8pt". You can try other fonts like "Arial 8pt", "Arial Narrow 8pt", "Bell Gothic Std Black 8 pt" "Aharoni 10pt" and "Bell Gothic Std Light 8pt" for different types of bar graphs. Let us here (through comments) if you would like to share any other tips and your views on this tip
3 Comments:
awesome trick....
HI Really Nice tip. Keep Posting......
Thanks
VPPS Group
That's what I love about excel - been using it for near to 20 years and I can still learn new things.
Excel Training | Los Angeles
Post a Comment